Paste a spreadsheet, get a dashboard
12 August 2026
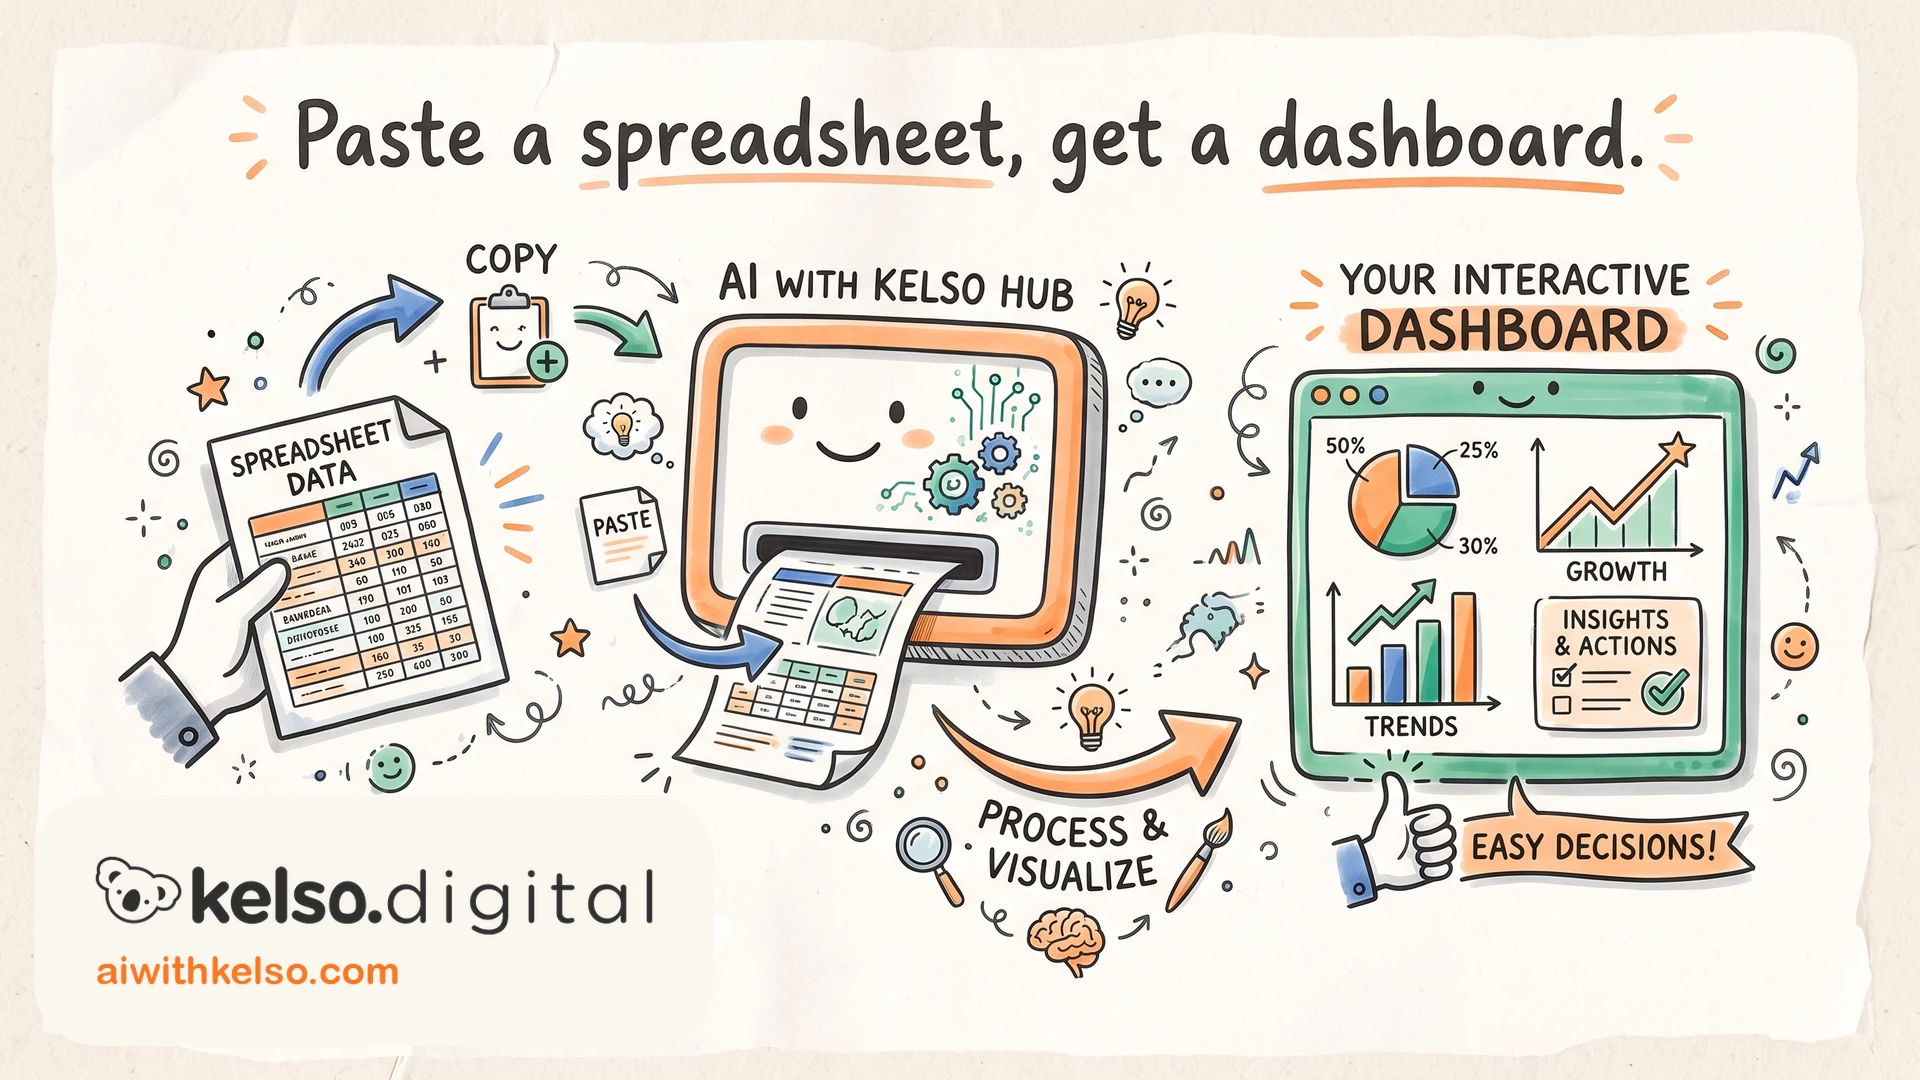
I love seeing my business data in charts, and for years I hardly ever made any. Figuring out the right graph, then wrestling it out of Excel, was enough hassle that the numbers just sat there.
You're probably sitting on the same kind of pile. The answers are in your data, but nobody looks at them, because getting one answer out of Excel used to cost an evening with pivot tables.
Now you can paste a spreadsheet straight into Claude and ask for what you want to see. Busiest month, best client, where the drop happened. It builds the chart on the spot, and the chart is interactive, so you can point at any bar and get the exact number behind it.
Ask a follow-up and it rebuilds the chart to answer that question instead. Hand it six months of invoices and ask which services make money and which cost it. You never touch a formula or a chart wizard.
Last week I pasted in our team's time allocation per client and asked for one chart: our hourly rate against our realised rate, client by client. It made painfully clear which clients we've been consistently undercharging. The numbers had been sitting in our tracking sheet all along.
Data is one of the most important assets your business has, and most of it goes unused because turning it into something useful was too much work. That excuse is gone.
Paste last month's numbers into Claude and ask it to show you the story.